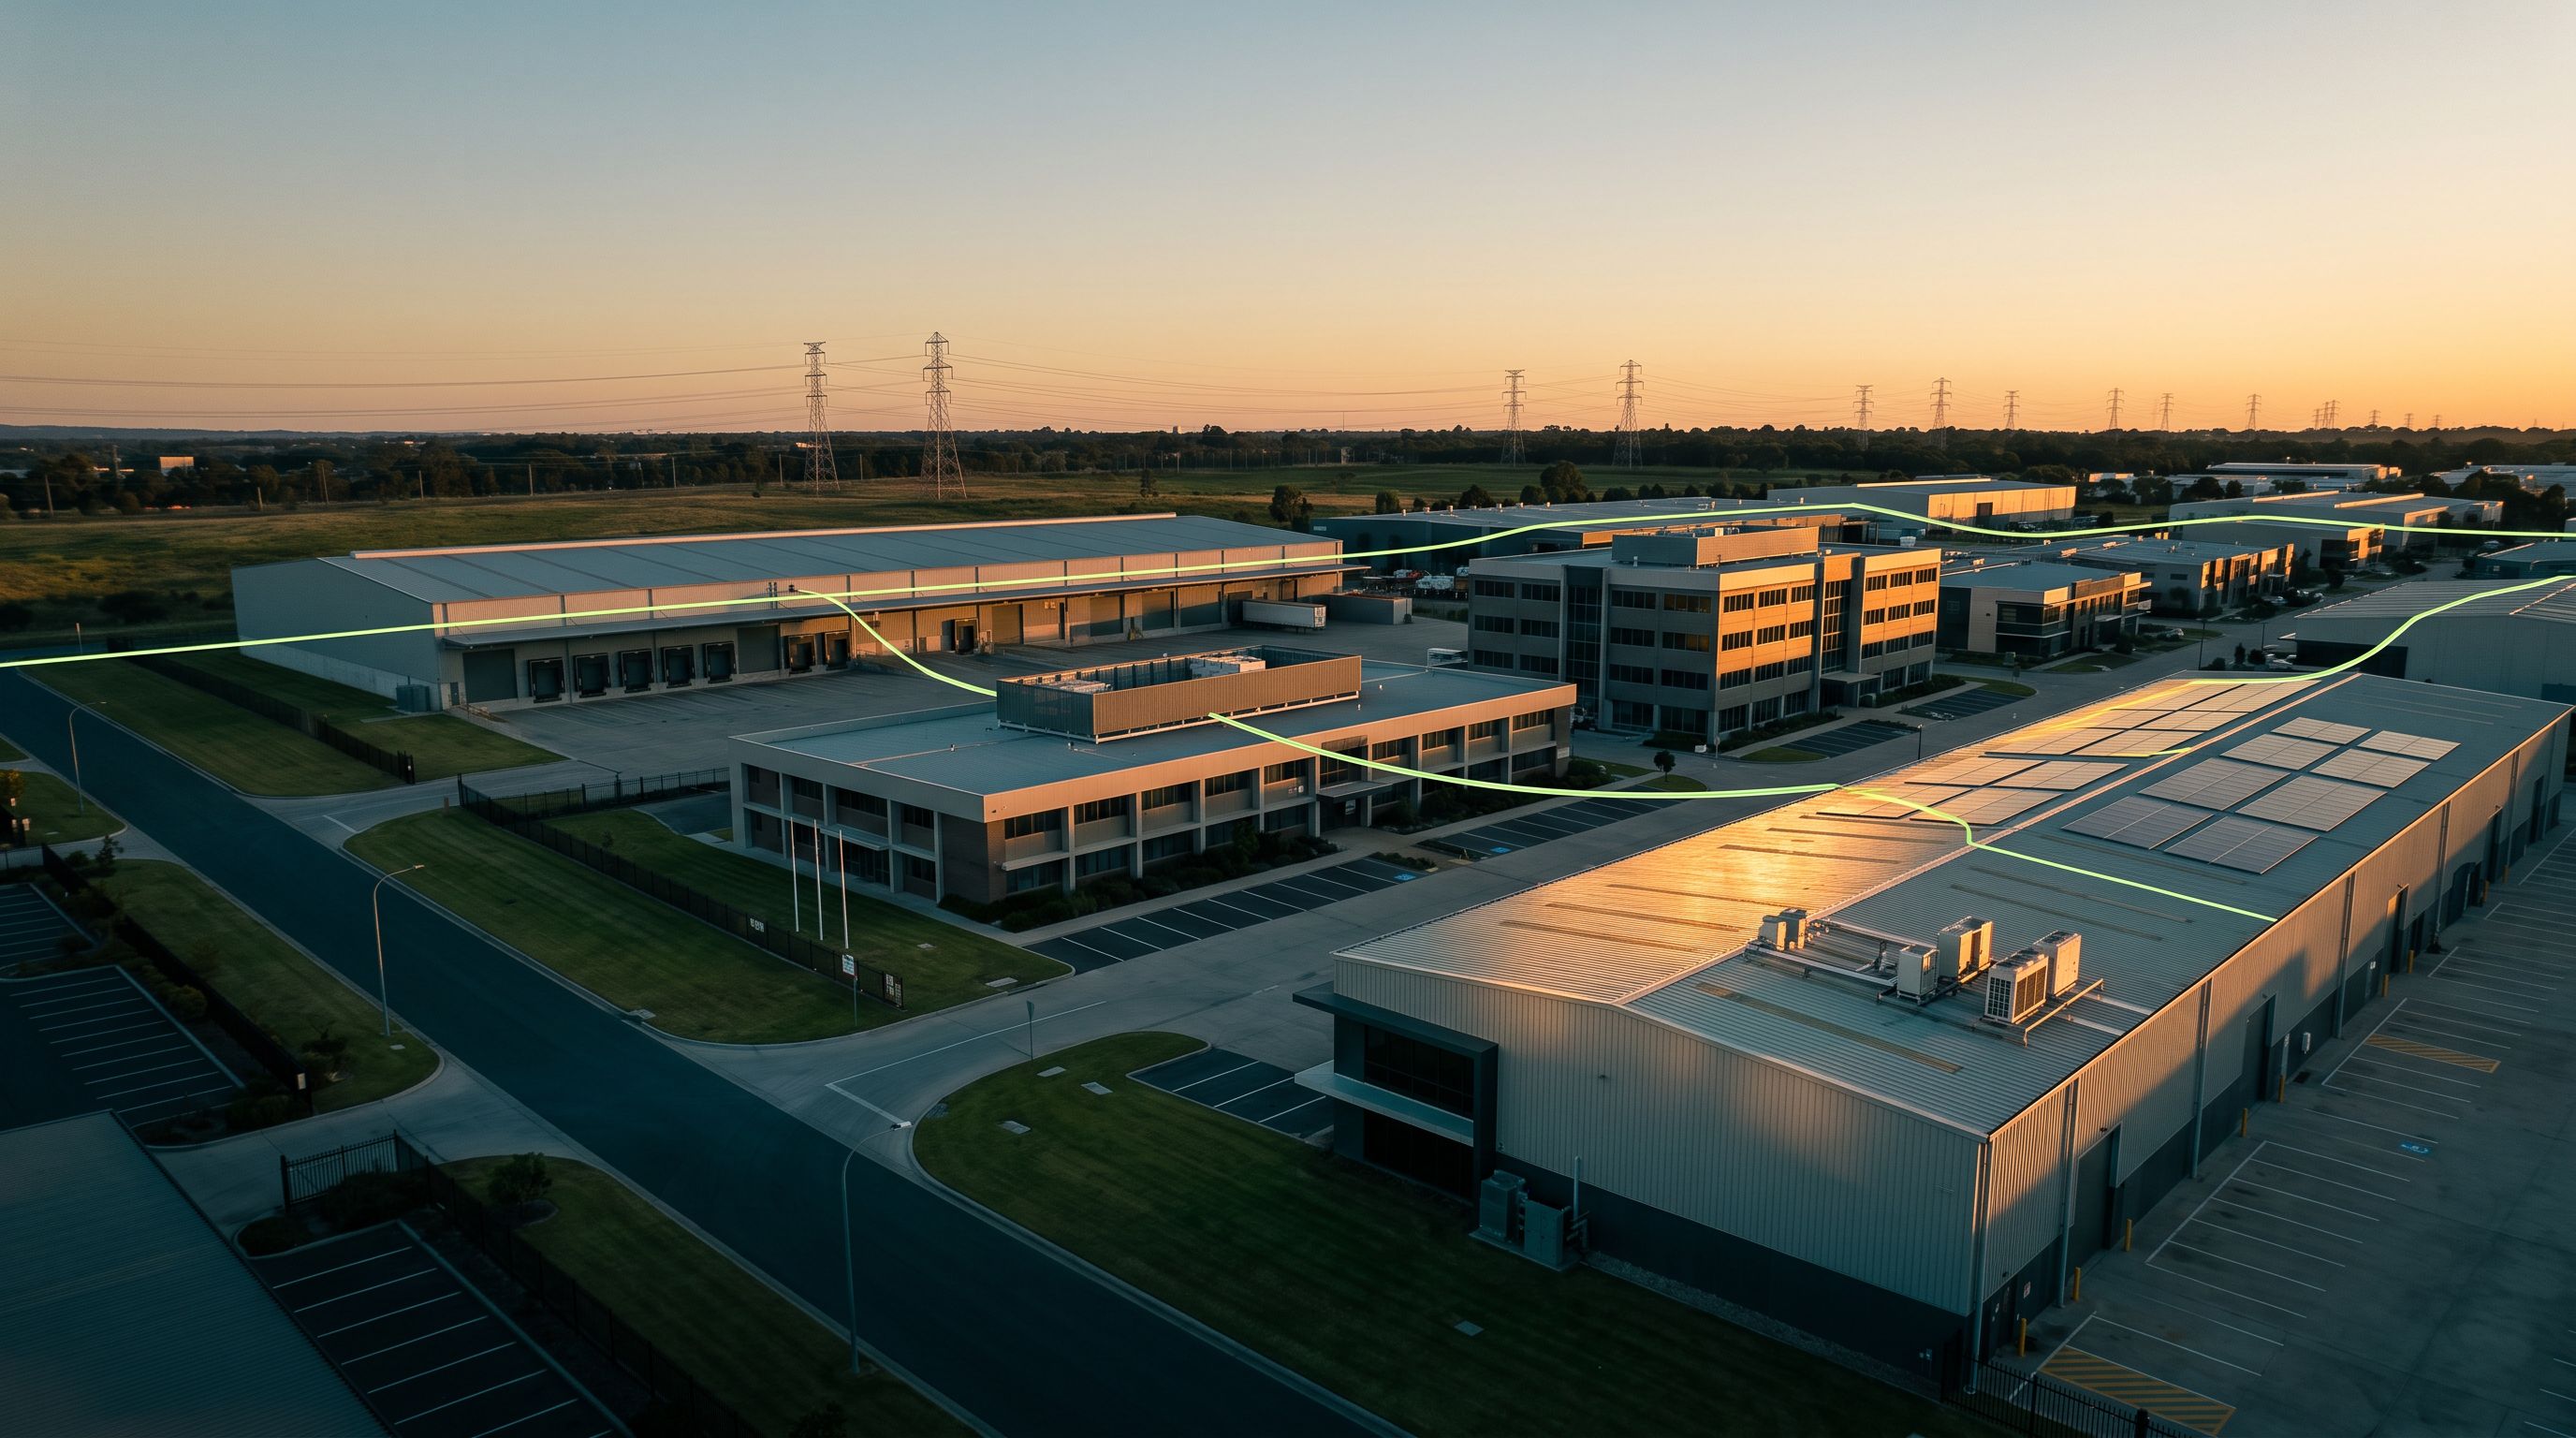
Four things that decide whether a site fits
Eligibility is set by the program and the provider, not by us. These are the factors that determine it.
Enough load to matter
Programs are built around meaningful reductions. Larger, steadier consumption gives more to work with.
Something you can shift
Non-critical processes, HVAC, pumping or lighting that can ease back for a defined window without harming output.
On-site assets, if you have them
Standby generation or battery storage can carry the reduction instead of changing how the site runs.
The right territory
Programs vary by utility and grid operator. Where your meter sits determines what is available.
Where demand response usually fits
Healthcare
Standby generation already in place
Education
Predictable schedules, shiftable load
Retail and property
Small reductions repeated across sites
Manufacturing
Non-critical processes moved off peak
Data centers
Backup generation, managed cooling
Cold storage
Thermal mass absorbs short reductions
Water and wastewater
Pumping moved around events
Agriculture
Irrigation with seasonal flexibility
What actually changes at your site
The most common objection to demand response is disruption. These are the terms that limit it, all agreed before you enroll, not during an event.


You set the limits
Which loads can move, by how much, and how far they can be reduced is agreed in advance and written into your participation terms.


Events are bounded
Programs define how long an event lasts, how often they can be called, and the notice you receive beforehand.


Performance is measured
Reductions are measured against a baseline. You see what was delivered and what it earned.


Someone answers the phone
A named contact who knows your site handles questions before, during and after each event.
Demand response is already at work
Every US wholesale electricity market pays for flexibility, but how much it relies on it varies. This is how much demand response each market could call on in 2024, and the share of its peak demand that covers.
MISOMidcontinent ISO
12,954 MW10.6% of peakPJMPJM Interconnection
8,526 MW5.7% of peakCAISOCalifornia ISO
4,373 MW9.0% of peakERCOTElectric Reliability Council of Texas
4,099 MW4.8% of peakNYISONew York ISO
1,921 MW6.1% of peakSPPSouthwest Power Pool
968 MW1.8% of peakISO-NEISO New England
431 MW1.7% of peak
68%
of the peak reduction that US utility demand response programs could deliver in 2023 came from commercial and industrial customers. Industrial sites alone supplied 45%.
63%
of the electricity sold to US retail customers in 2025 was bought by commercial and industrial customers.
Sources: FERC Staff, 2025 Assessment of Demand Response and Advanced Metering (Table 3-3, 2024 wholesale market data; utility program data from EIA-861, 2023). U.S. EIA, Electricity in the United States (2025 retail sales). What a site can earn depends on its market and program.
Find out what your site qualifies for.
Start with a short conversation about your facility, its load and its assets.